The pathways of methane emissions from human production and consumption activities remain obscure, hindering the formulation of targeted methane reduction strategies. This study compiled extended inter-country input-output (ICIO) tables, linking 14 major sectors across 67 economies with methane emissions data from 2000 to 2018. We identified high-emission linkages between sectors, analyzed the evolution of China’s methane emissions structure within these linkages, and explored the underlying reasons for inter-annual methane emissions changes. Our findings reveal that China’s role in the emissions embedded in international trade networks has become significant, forming an Asian emission community, with its methane emissions embedded in import trade exceeding those in export trade by 2018. China’s methane emissions from domestic production accounted for over 95% of total emissions, with the top-5 key linkages contributing to more than 50% of domestic production emissions. Per capita GDP emerged as a key driver of increasing methane emissions in these linkages, while emission intensity reduction had the opposite impact, albeit with a diminishing effect. Moreover, simulations of three scenarios indicated that emission intensity reduction is the most effective for methane emission reduction. We estimated that by 2025, the emission intensity in the energy mining and production sector, agriculture sector, and waste treatment and discharge sector would decrease to 0.0086, 0.0029, and 0.0014, respectively. This could potentially reduce over 65% of the emissions embedded in China’s top-5 key linkages of export trade and four of the top-5 linkages of domestic production by 2025, compared to 2018 levels. Based on this analysis, several potential directions for methane emissions reduction in China were proposed.
Publication:
Journal of Cleaner Production (Top Journal in Environmental Science, JCR Q1, IF=11.072), Vol.485, 144372 (2024).
https://doi.org/10.1016/j.jclepro.2024.144372
Authors:
Zijie Cheng
Academy of Mathematics and Systems Science, Chinese Academy of Sciences, Beijing 100190, China;
University of Chinese Academy of Sciences, Beijing 100049, China
Xiuli Liu (Corresponding author)
Academy of Mathematics and Systems Science, Chinese Academy of Sciences, Beijing 100190, China
University of Chinese Academy of Sciences, Beijing 100049, China
Center for Forecasting Science, Academy of Mathematics and Systems Science, Beijing 100190, China
E-mail: xiuli.liu@amss.ac.cn

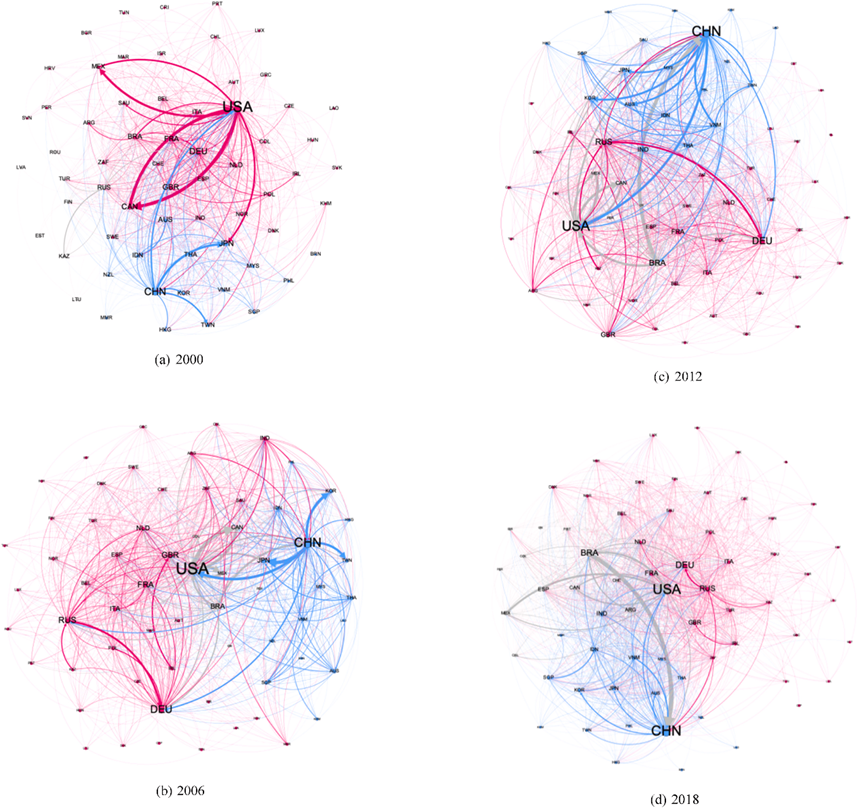
图1. 2000年、2006年、2012年和2018年全球主要经济体国际贸易中隐含甲烷排放的网络流

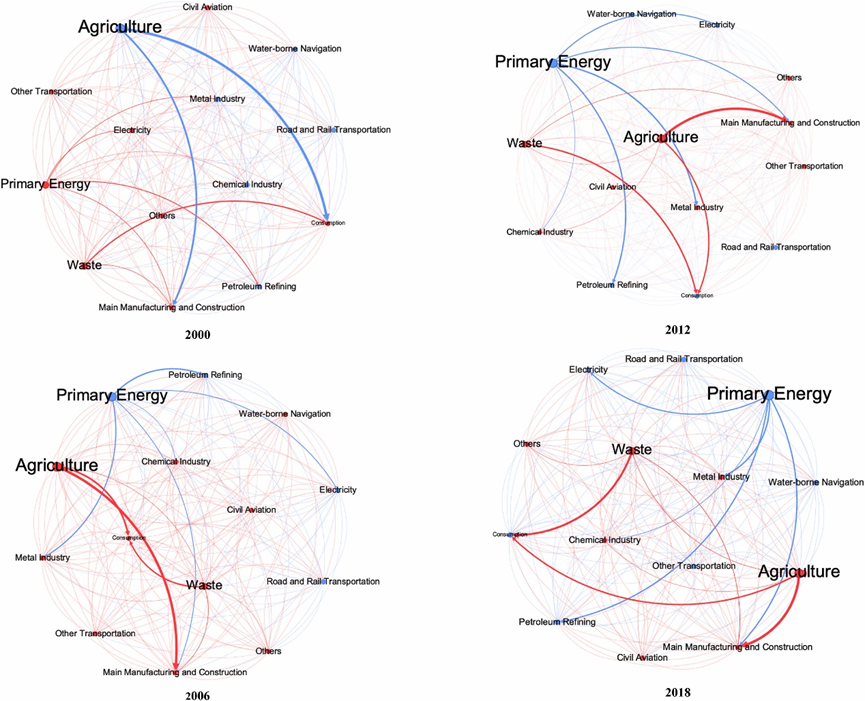
图2. 2000年、2006年、2012年和2018年中国国内生产系统中隐含甲烷排放的网络流

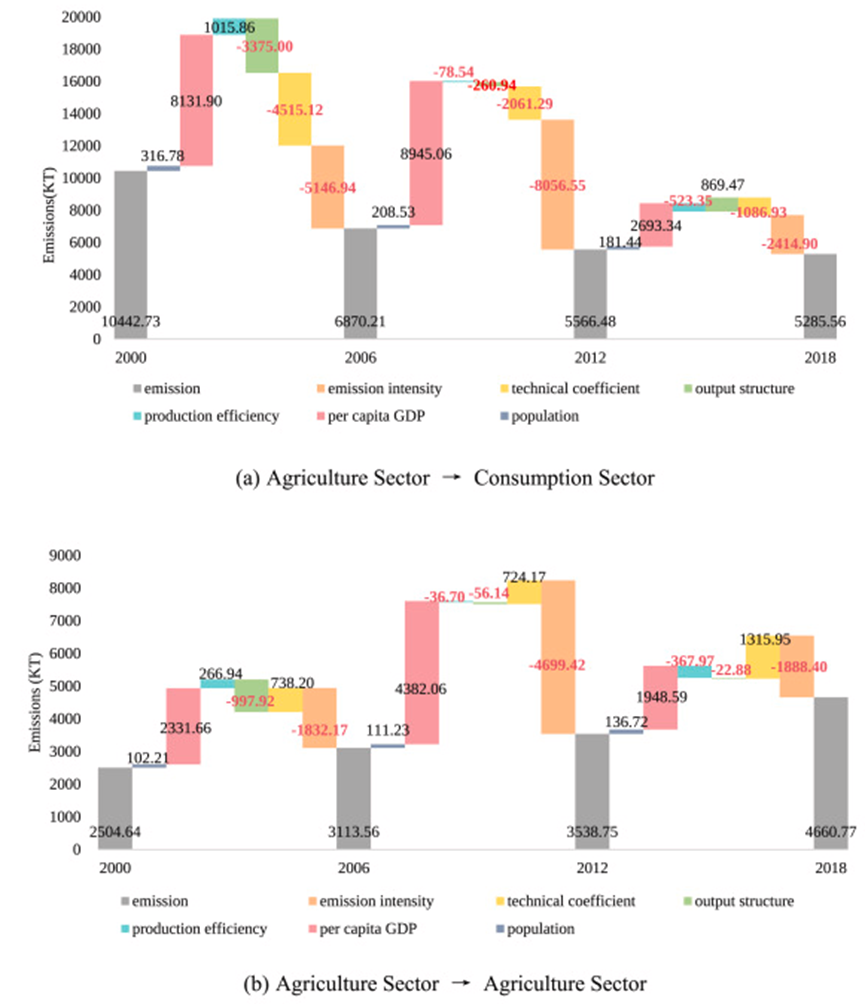
图3.2000、2006、2012、2018年度间我国从农业部门到消费部门,及从农业部门到农业部门的产品投入中隐含甲烷排放量变化的6个驱动因素的分解分析

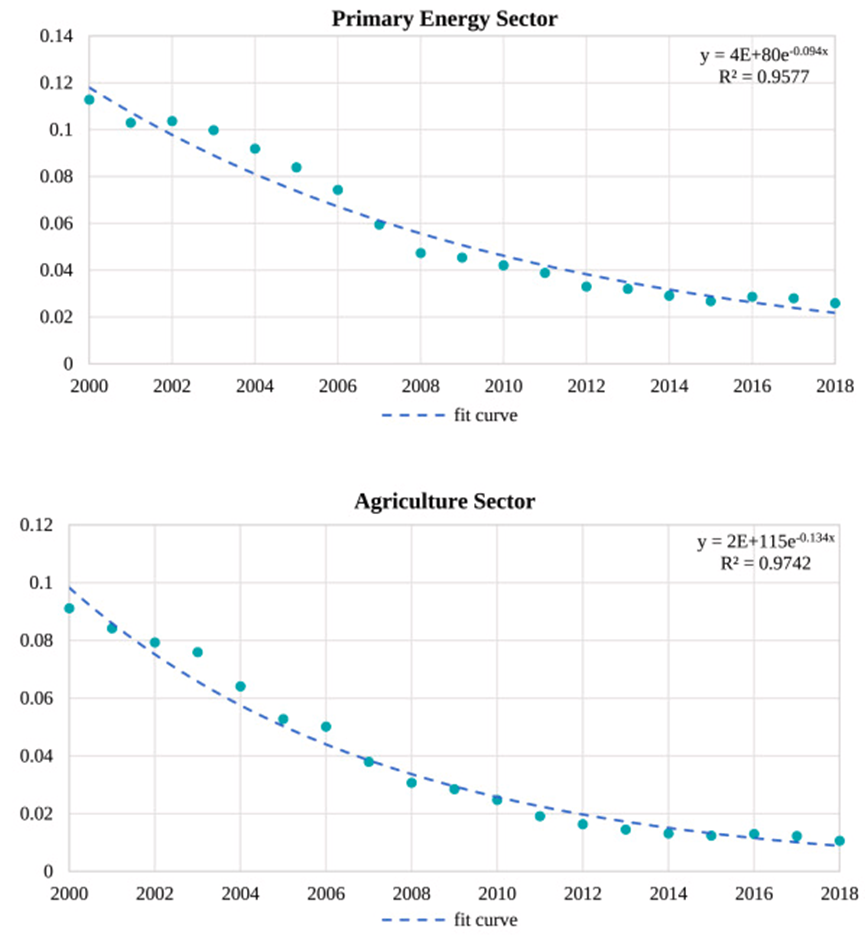
图4. 2000-2018我国一次能源部门、农业部门的甲烷排放强度变化及其拟合曲线
附件下载: